Since January, the Philippines has been alert due tothe COVID-19 outbreak that’s happening all around the world. Flights have beensuspended, communities are put on quarantine, and, seemingly, life is on pause as weall speculate where the virus is.
COVID-19 World Map
One of the most popular solutions is the map made by Johns Hopkins. Iit tracks all the COVID-19 around the world, in particular, the number of confirmed cases, deaths, and recovered patients. Though useful to observe the spread of the virus around the world, the dashboard may not be as useful as the data is aggregated for countries.
COVID-19 Maps in the Philippines
![]()
One of the efforts made is done by DOH where are the reported cases are manually updated with their interactive map. It contains comprehensive data about the cases in our country.
![]()
Another data aggregator is the Philippine Coronavirus Outbreak Wikipedia page. It reflects data from the DOH website and various news articles. It clearly shows which areas have suspected and confirmed cases of the Coronavirus. However,there is only minimal control of the visualization.
Our Own COVID-19 Tracker
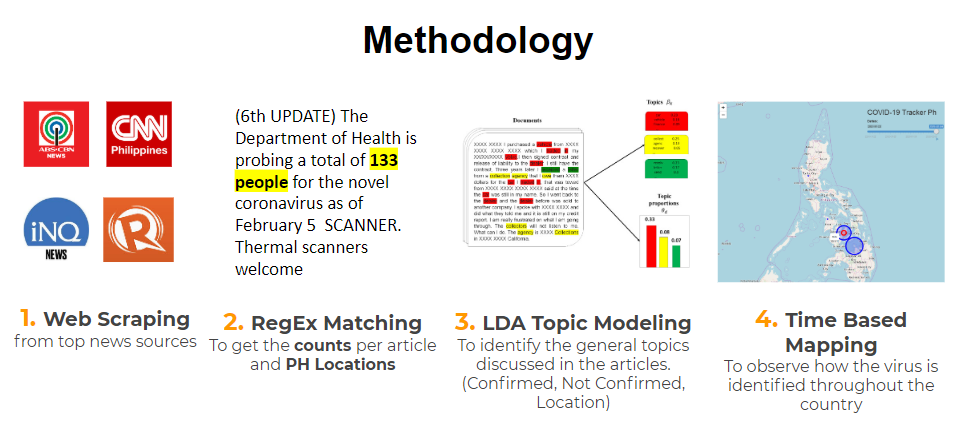
Instead of waiting for the official announcements from WHO or DOH, we observed that getting updates from news can be much faster since the media are onsite and report real time. Our goal was to make an automated news aggregator that maps COVID-19 cases through time.We scraped all the news articles related to COVID-19 from various news sources in the country. Our first problem was to identify the right counts of confirmed and suspected cases. We did this by using ReGex, where you define a series of characters to define a search pattern. Using ReGex, we took all the numbers and the words beside them from each article to get the case countand province.
One would normally have to read each of the articles in order to identify which are about confirmed or suspected cases of the virus. These articles then went through LDA Topic Modeling summarize the article with a few keywords.Consequently, the parsed data were summarized and mapped through time in an interactive map.
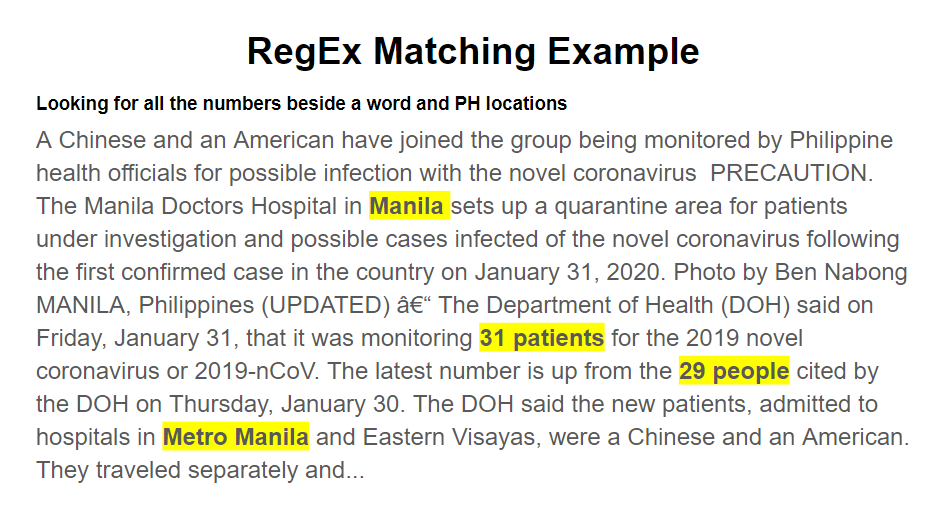
This is an example of how ReGex gathers all the counts in one news article. Philippine provinces were also be parsed by ReGex as the location of the cases.
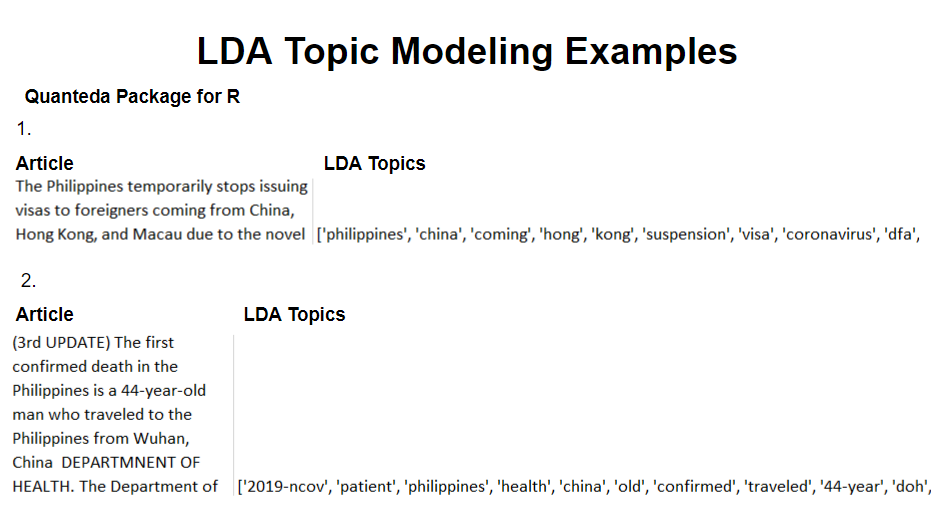
Topic modeling is simply the process of identifying topics in a given group of text by analyzing the patterns of words, which saves you the time of reading the entire text just to get the context. Latent Dirichlet Allocation was used for topic modeling, an approach that doesn’t care about the arrangement of words but the number of times a word appears. The more frequent a word appears in a topic, the more likely it is to be a keyword that summarizes the article. With the two examples above, you can already get the gist of the article by just reading the LDA topics, which is highly useful in identifying whether an article is about a confirmed case or not.
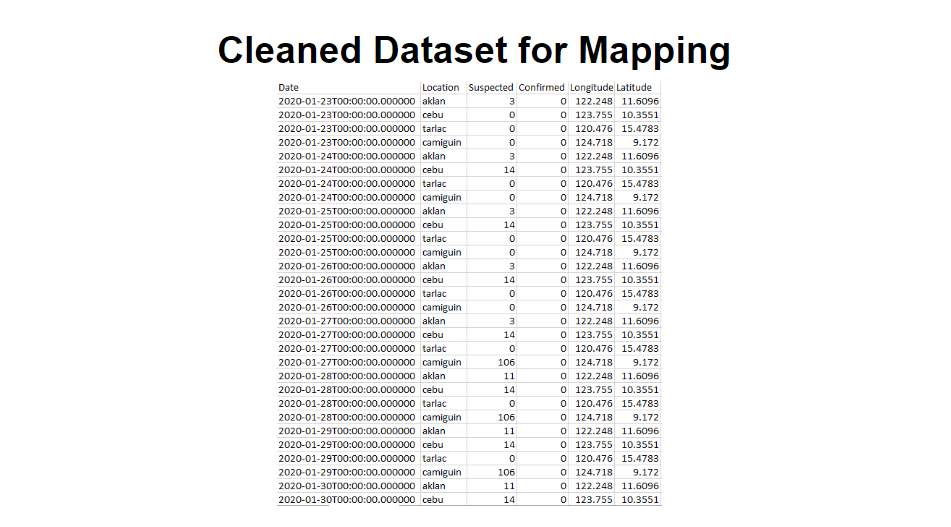
To create a dataset to be used for mapping, the data would then go through a series of other preprocessing methods to finalize the locations and counts for each area .
Our Prototype Map
![]()
Using the final dataset, the results were mapped out using Keppler, an open source mapping software that is easy to use. Keppler also has a time slider that allows you to control the state of the map by choosing a given time period. During this time, we found that most of the virus was just located in the Visayas and Mindanao islands and concluded that there wasn’t much cause for concern for those here in the Luzon area. Thus, the call was to stay vigilant and hygienic.
Please do note that the map is still in its prototype stages and should not be used as a basis in getting the official counts of cases in the Philippines.
Our Next Steps
Currently, the map is only good at identifying areas that have cases of COVID-19 in the Philippines. Our methodology has problems identifying the correct counts for suspected or confirmed cases, mainly because:
- There are articles that repeatedly talk about the same thing. An example is there having a COVID confirmed case a few days ago then having an article today which references the previous case,, which can cause the parsing method to take the wrong count.
- There are some keywords that possibly signify suspected cases in an article that we missed taking into account.
- Some wrong counts were used because the article due to a mention of “Philippines”, but actually takes place elsewhere.
To address these concerns we are looking into the following solutions:
- Increase our news sources as we are currently only using two for the Prototype
- With the increased sources, a voting system will then be put in place to identify whether a count is true or not.
- An EDA of n-grams in an article to analyze the keywords that may be used for identifying articles that talk about confirmed (or suspected?) cases.
- Using word2vec as a data preprocessing method in order to further strengthen the topic modelling by taking context into account.
Once these problems are fixed, this will unlock the map’s full potential. By simply changing the keywords, this will not only be able to track COVID-19 cases but other events, ranging from Polio cases, storm victims, dengue, and the like. Hopefully, once the capabilities of this mapping system are realized, different sources would allow us to directly connect their data in order to create aware citizens on the current and relevant events in the country.