Introduction
First reported late December 2019 in Wuhan, China, the current number of COVID-19 confirmed individuals has surpassed four million. Several countries have imposed measures to prevent the spread of disease, including public transport, school and workplace closures, public event cancellations, and local or national lockdowns.
The Philippines has also implemented such measures in the form of an “enhanced community quarantine”, with the hopes of flattening the curve to avoid stressing our health system to its full capacity. However, we continue to have a lot of questions, especially as we’re stuck at home. How do these interventions actually help prevent the spread of disease? How much can we flatten the curve? In this article, we hope to simulate interventions including social distancing, lockdown, and mass testing to gain a better understanding of how these interventions work.
Agent-based Modelling and Netlogo
We use agent-based modelling through Netlogo as this allows us to model interactions between agents and simulate different environments. Our agents have randomized movements but we can characterize them by giving properties, such as hygiene. Our environment can be specified as well, such as providing a strict social distancing measure between individuals. Additionally, since implementation of interventions vary throughout different municipalities, we can adjust the intensities of interventions.
Through these simulations, we can observe how agents navigate the pandemic given environment variables of social distancing, lockdown, and mass testing. Consequently, we can observe and quantify the effect of these interactions on recovery and death rates. Figure 1 shows the Netlogo interface, the parameters, a graph of a sample intervention, and the space in which agents are found.
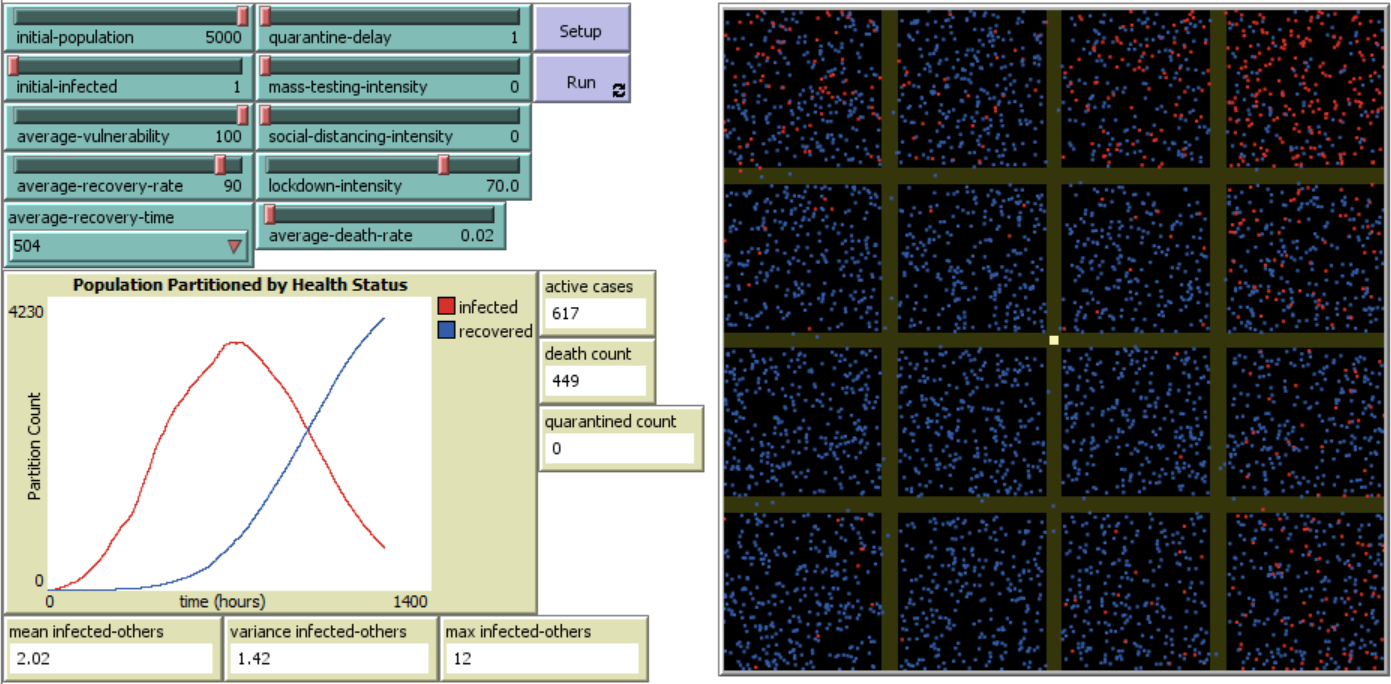 Figure 1. Agent-based modelling in Netlogo.
Additional details of our model can be found in this Github repository and part I of this article. However, a caveat to this analysis is that it is a simplistic model of the complex COVID-19 pandemic. The agents are random and have random movements, unlike in real life. Although this model cannot provide any predictions, our goal is to compare interventions and identify potential next steps.
Parameters of Interest
One of the first promoted behaviors during this pandemic is social distancing. In our project, we modelled social distancing intensity as the probability of agents to observe the right distance from other agents. The more intense the parameter, the more probable agents are to stay six feet away from each other. For instance, if the setting is set at 20% intensity, only 20% of agents observe social distancing.
Another intervention undertaken during this pandemic is a lockdown. We designed the lockdown intensity parameter in this project as the probability of an agent to cross a border successfully. This parameter attempts to model agents’ behavior of crossing between boundaries, such as cities or provinces. Since agents move around randomly, this parameter is only activated once an agent attempts to traverse a border (defined as green lines). The more intense the parameter, the less likely an agent is to cross borders. For instance, if the setting is at 20% intensity, agents who try to pass a border are likely to succeed 20% of the time.
Lastly, although this is not an intervention that is implemented by an external body, we also measured agent vulnerability. Agent vulnerability is a characteristic that we gave to an agent to describe their hygiene in terms of wearing masks or washing their hands. The assumption for this parameter is that the more hygienic an agent is (lower vulnerability), the less likely they are to be infected when interacting with infected agents.
Findings
After analyzing the model, a few insights are apparent:
- Social Distancing has the lowest infection rates among all our simulations.
- Lockdowns result in multiple peaks of infections.
- Personal hygiene improves an intervention method’s effectiveness.
Social Distancing matters
Our model has two parameters that are closely linked to individual physical hygiene: social (or physical) distancing and agent vulnerability (hygiene). Our simulations revealed that both are necessary interventions to prevent the spread of infection. The graph reveals that with social distancing alone, the curve is flatter compared to other interventions. Thus, it appears that we, as individuals responsible for our own hygiene and behavior, are the frontliners in preventing the spread of COVID-19.
The results can be further understood through the simulations below. The spread of the virus is slower for agents that follow social distancing rules compared to the other simulation where agents partially follow lockdown procedures without much social distancing involved.
| Social Distancing Simulation | Lockdown Simulation |
|---|---|
| w/o lockdown implemented | w/o social distancing followed |
 |
 |
This appears to be true even in the real world scenario. Sweden already reports a plateau in their infection and fatality rates. The government’s strategy was met with outrage from the international community, considering how lax. They asked their citizens to be responsible and observe proper social distancing, which now resulted in stabilized numbers. However, we must add a caveat for this scenario. It might be possible for Sweden but it could be irresponsible and inhumane to ask the same for the Philippines, with our denser homes and a weaker health system.
Partial Lockdowns Result in Multiple Peaks of Infection
Lockdowns are expensive and disruptive interventions, causing plunging markets, layoffs, closed businesses, and even negative oil prices. It is no surprise that we all want to go back to normal life. But what happens when a lockdown is lifted? Germany has reported that their infection rates suddenly increased after easing their lockdown. Additionally, there are reports of a second wave of infection in some countries of Asia.
In our simulations, we found that partial lockdowns indeed result in multiple peaks of infection. This happens because agents are able to roam from one area to another.
This is seen in our simulation below. When an infection is present in one area, an agent can bring the infection to another area. This results in another surge of infections coming from that newly infected area, resulting to new waves of infection that results in peaks.
One example is comparing the curve of NCR and Region 7. When taken as a whole, it appears that the Philippines is at its second peak of infection. However, a closer look into NCR and Region 7 numbers will reveal that the first peak comes from NCR and neighboring provinces while the second comes from Region 7. There is merely a lag in the peak of certain regions due to the delay of transmission from partial lockdowns.
Data Source: DOH Data Drop
Lockdowns appear to be helpful in flattening the curve. However, lockdowns must be lifted with a lot of data and the necessary precautions. One of the most important may be strengthening health system capacity in areas near highly infected regions so they are able to handle potential localized peaks of infection.
Personal Hygiene Helps Reduce the Rate of Infections
As recommended by WHO and other health organizations, washing of hands remains the no. 1 tip for preventing getting infected during the pandemic. We took into account an agent’s personal hygiene in getting infected on top of the interventions with regards to washing of hands and cleanliness. As an example below, this is a comparison of agents doing social distancing being compared to the same procedure but with agents following personal hygiene.
As another example, we did the same thing for the lockdown simulations in the chart below.
We can see that for both these intervention methods, the rate of infections has been reduced once the agents follow hygienic practices.
Conclusion
Our simulations revealed that certain measures may be necessary to flatten the curve. Among these are strategic lifting of community quarantines or lockdowns. Nonetheless, one important finding is directed towards our own behaviors during this time. It appears that individual behavior matters a lot in preventing the spread of COVID-19. We applaud our frontliners who have been working for almost two months now but we, ourselves, have our own responsibilities to prevent the further spread of disease. Thus, if we can, we must practice physical distancing and good hygiene.
What’s Next for Our Model
Our model at it’s current state enforces very simplistic rules for our agents to follow. For our next steps, we’ll modify the model to further imitate the real life behaviors of people with these different interventions methods by adding additional parameters. In our current model, we tried try to replicate mass testing behaviors in our simulations, but the rules are too simplistic as it is right now to make an analysis, resulting to most of the mass testing simulations having similar results.

Our agents still move around after being tested for the virus in our model, resulting to them still being at risk of getting infected. For the next phase, we’ll focus more on the effects of mass testing in a population that’s facing a pandemic by improving our parameters to be more realistic.