Road accidents kill thousands of Filipinos every year.

Based on a dataset from a Global Burden of Disease Study, the Philippines is among the top 5 countries with highest mortality rates related to road traffic accidents. The country has roughly 10 thousand deaths recorded in 2017.
As illustrated by the red in Figure 1.1, we can see that the mortality rate for road traffic accidents almost increases every year for the Philippines. Despite having high mortality rates, the mortality trends for countries like Indonesia, Thailand, and Myanmar are downward. This is what we hope to achieve for the Philippines.
How much has each country invested?
To understand the context, we look into the investment per capita for each country. Data from the Private Participation in Infrastructure Database shows the total amount each Southeast Asian country has invested towards the improvement of their respective transport infrastructure.

Among the countries with available data, Figure 2.1 shows that the Philippines is in 5th place with around $16,000 per capita invested.
Upon comparing the transport investment amount per capita with the number of road traffic deaths, we can see in Figure 2.2 that the countries that have invested the most in their transport infrastructure have the least amount of deaths. However, the graph also shows one outlier country, Myanmar. They have invested the least in transport, yet their road traffic related mortalities are lower than expected.
This may be a relevant discussion point considering the Philippine government promises to halve road crash fatalities by 2030. To ensure that the additional investments allotted for road transport are pedestrian-friendly, we dig deeper into the current issues of the Philippines.
Our pedestrians have the highest rate of deaths
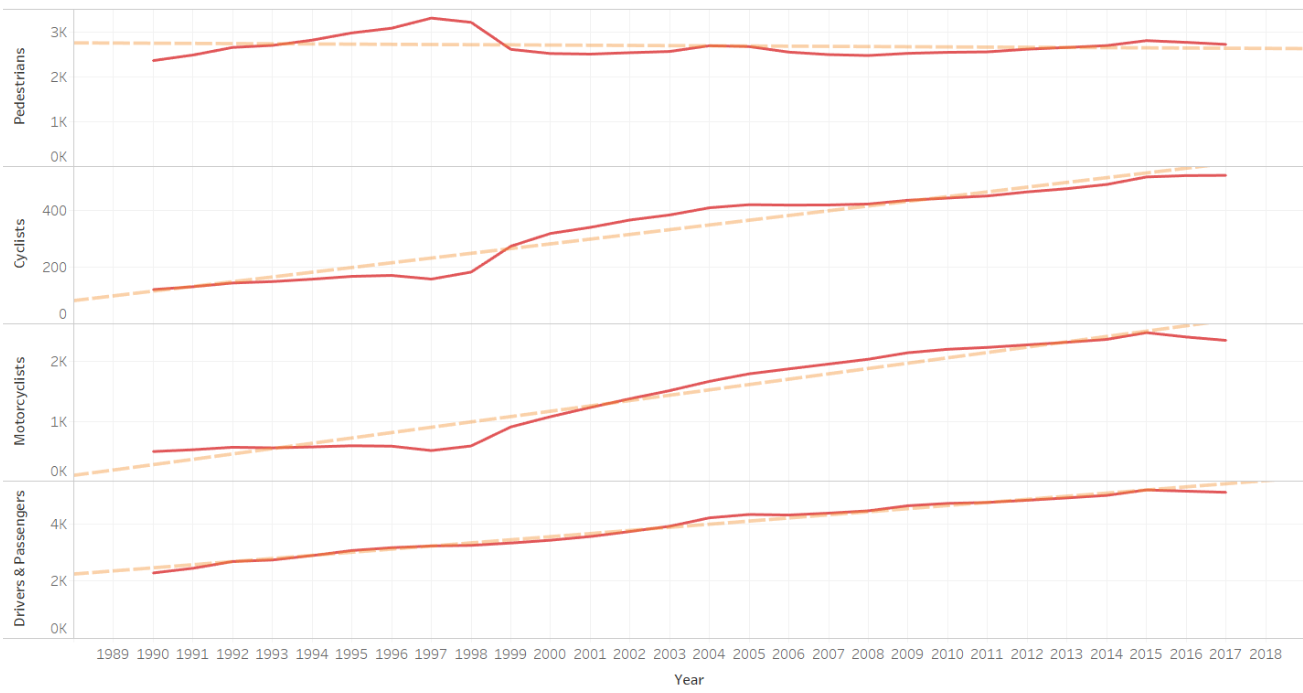
Figure 3.1 categorizes the deaths shown earlier in Figure 1.1 by pedestrian, cyclists, motorcyclists, and drivers & passengers. The orange trend lines represent the road traffic deaths per category. We can see that the road traffic deaths for all categories, except for pedestrians, are increasing. This might be a direction to de-prioritize pedestrians and address other categories. However, if we look at the numbers more closely, pedestrians have it the worst among all the categories since 1990.
Around 3,000 pedestrians die every year in the Philippines and that number has been consistent. The other categories are on their way to catch up to the pedestrian numbers but it still remains that most of the casualties come from pedestrians, especially when summed out.
The Philippines is on its way to be third in yearly cyclist deaths
Another relevant point to focus on is cycling. Public transport has been on halt at the start of the pandemic. Thus, Filipinos have turned to biking to get from place to place.
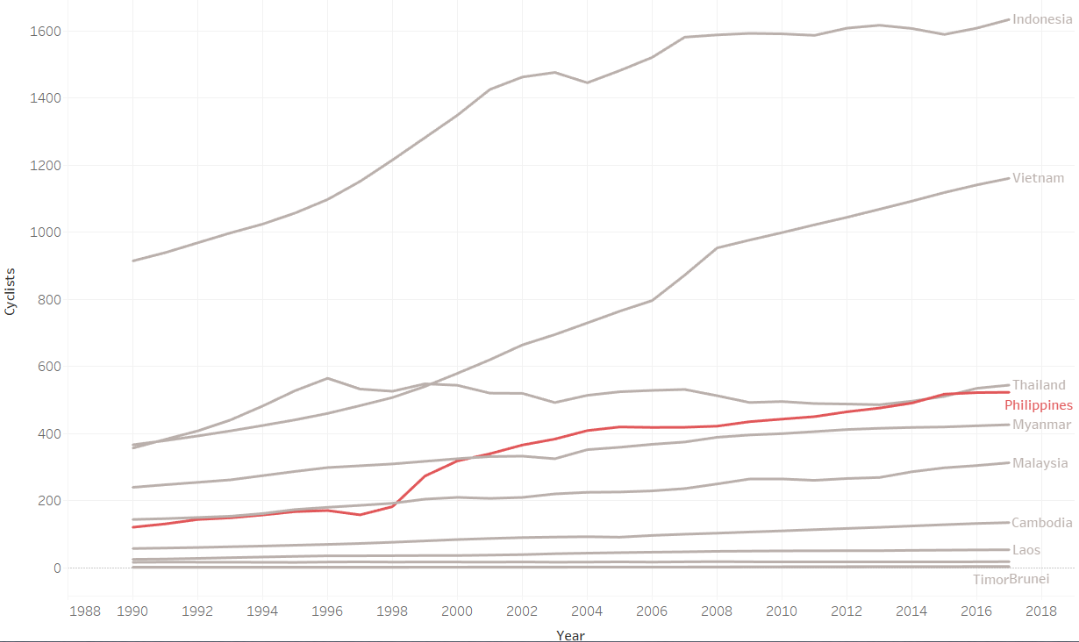
Compared with to other countries, an interesting trend is the one for cyclists in SEA. The red trend line represents the Philippines. Comparing this trend with others, our country appears to be on its way to have the third highest mortality rate for cyclists. Given the increase in biking since the pandemic, could there be a rise in mortalities this 2020?
The Philippines has the lowest number of railways implemented
The data from the International Union of Railways illustrates that the Philippines has the least amount of railways available.
If we compare the transport investments to the total railroads per country, some countries have invested less than the Philippines yet, have a higher number of railroads.
What should the Philippines do?
In summary, these are potential points of focus to improve the transport infrastructure in the Philippines:
- Effective measures in reducing pedestrian casualties
- Invest in cycling infrastructure
- Improve railway systems
Our country has already started implementing improvements like the BRT system in Cebu This system not only improves bus transport but also pedestrian safety. We also have investments in road extensions like the 3 hour trip from Manila to Baguio via TPLEX and the Ortigas - BGC bridge These can potentially reduce road traffic. However, most of these developments are geared towards private vehicles.
In order for the Philippines to reduce private vehicle dependence, investments should be made towards alternative transport, such as walking, biking, and commuting. To achieve this, safe and efficient infrastructure must be in place.
“A developed country is not a place where the poor have cars. It’s where the rich use public transportation” – Gustavo Petro, Mayor of Bogotá
Data for Good Hackathon
This data analysis got second place on the Data for Good Hackathon. The United Nations Sustainable Development Solutions Network (SDSN) partnered with Eskwelabs, a data-science bootcamp in the Philippines, to host a Data for Good hackathon. The virtual hackathon was designed for those who were eager to learn more about how the Philippines is doing in achieving the United Nations Sustainable Development Goals (SDGs). Further analysis could be done by using updated datasets, if available.


