The Philippines Holds One of the World’s Longest Lockdown
When COVID-19 struck this year, most countries’ immediate measure in minimizing infections is having the country in a state of lockdown. Depending on how tightly implemented a lockdown is in a country, most of the regulations have people just staying in their homes, businesses closing down, and minimizing the use of public transportation.
With the Philippines having one of the world’s longest lockdown, it’s intriguing to see if the country has recovered the most in terms of C02 Emissions produced in 2020, given how the new normal has changed everyone’s behavior during the pandemic.
Google COVID-19 Mobility Report
To gain more context on how COVID-19 has changed each country’s behavior, data from Google’s COVID-19 Mobility Report show the total amount each Southeast Asian country has invested towards the improvement of their respective transport infrastructure.
The Community Mobility Reports show movement trends by region, across different categories of places:
- Grocery & pharmacy
- Retail & recreation
- Parks
- Transit stations
- Workplaces
- Residential

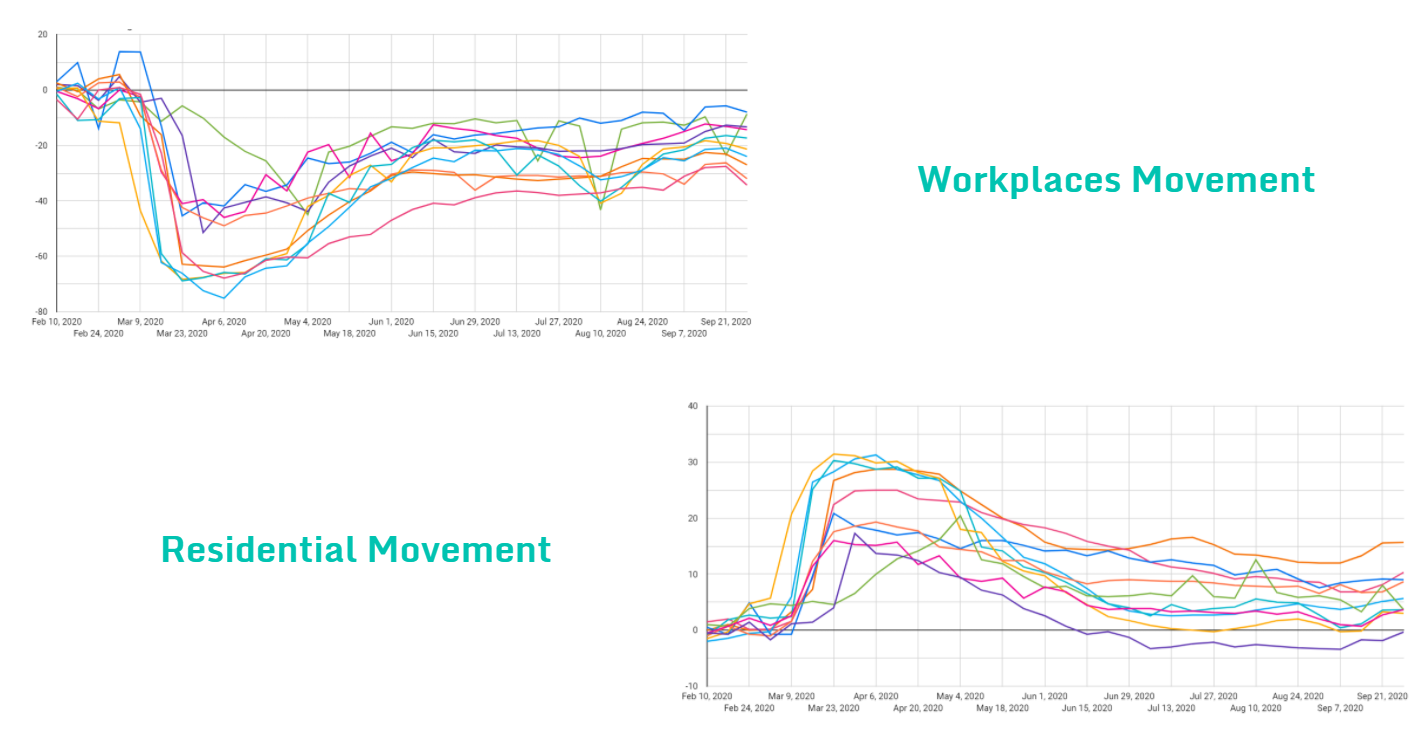
From March onwards, movement for areas outside homes like workplaces, parks, and recreation drastically went down while residential areas went up since people have mostly stayed at home during the pandemic, giving us an idea that residential movement is greatly correlated with how people move during the pandemic.
Carbon Monitor
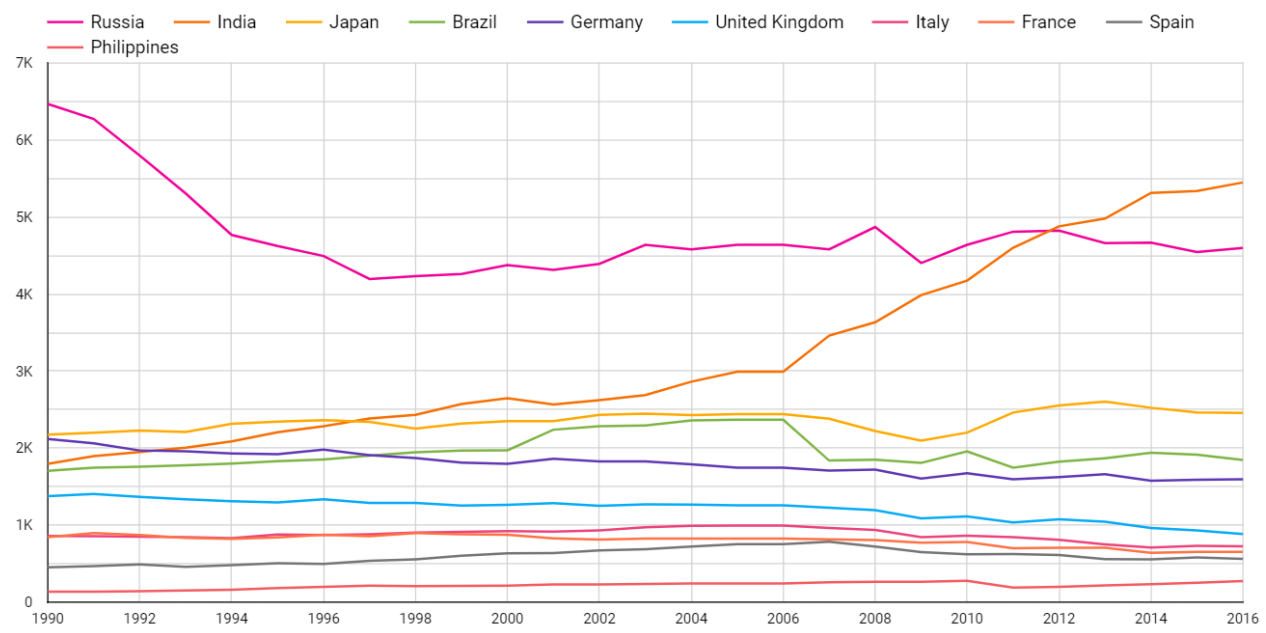
As for C02 Emissions in 2020, Carbon Monitor is a global initiative that uses science-based estimates to monitor daily CO2 emissions of different countries by region across different sectors.
For this study, we focused on Power and Ground Transport CO2 emissions as they are closely tied with movement data.

We can see that as residential movement increases, the C02 emissions for transport and power go down. Seeing that there is a correlation with movement data and C02 data, we have a way to predict C02 emissions through machine learning.

The Mobility Data set has a complete movement data for the Philippines. Since we have the movement & C02 data of other countries, we can train a model that understands how C02 is produced based on movement data and have it predict the Philippines’ C02 based on its movements.
Data Limitations
Despite having movement data, most of the countries’ trends are the same. So if we train a model just using these data, the Philippines would just imitate the C02 emissions of the country with the most similar movement to itself. In order to fix this, we need another dataset that makes the countries more distinct from one another besides their movement data.
Climate Watch
Climate Watch offers open data, visualizations and analysis to help policymakers, researchers and other stakeholders gather insights on countries’ climate progress.
They have data on C02 Emissions produced by various sectors:
- Energy
- Agriculture
- Industrial Processes
- Waste
- Land-use Change
- Forestry
With Climate Watch’s data, each country is now different from one another based on the C02 emissions they produce from each sector. With this data, predicting C02 emissions will not only base on how a country moves, but how each produces C02 emissions as well.
Predictive Model Layout
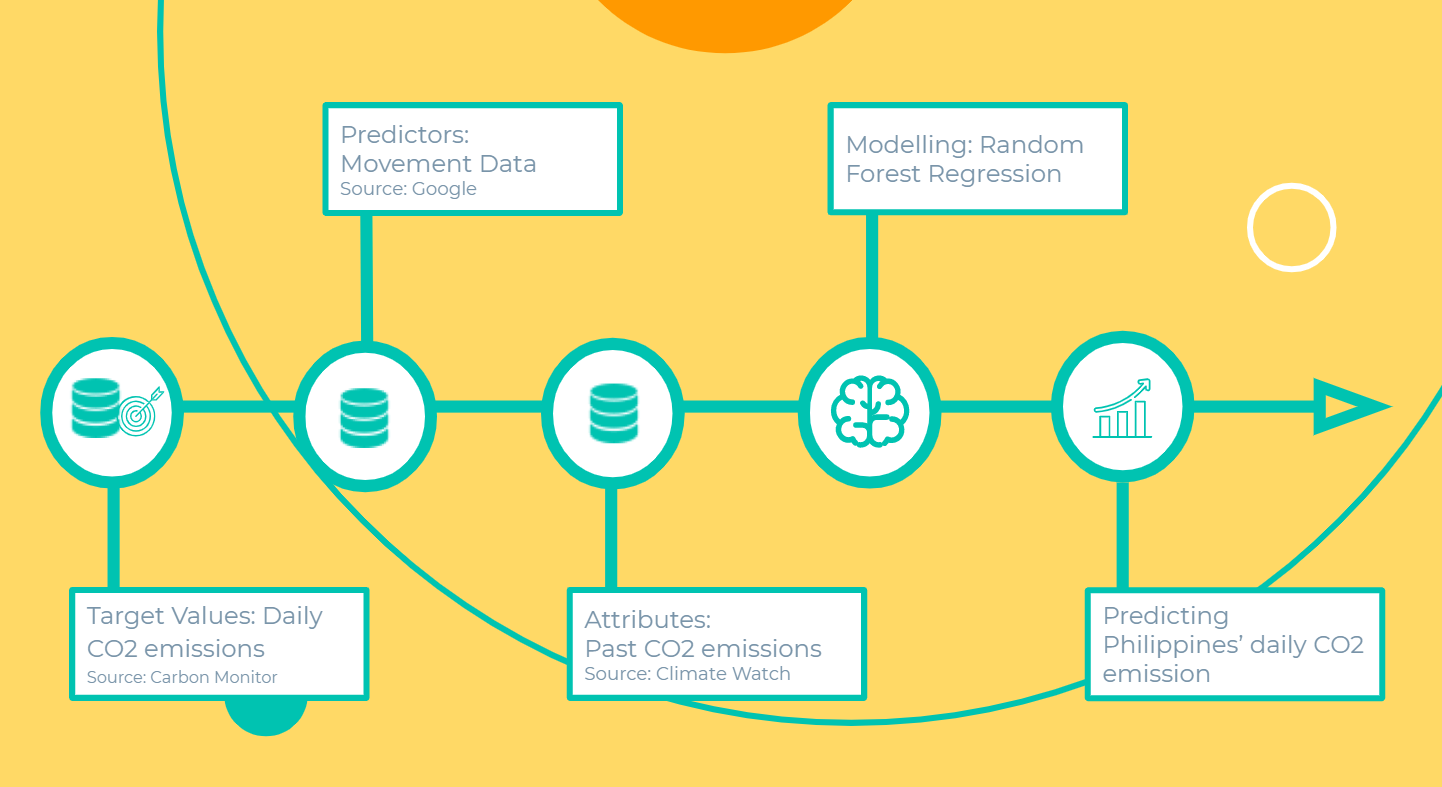
With everything in place, the diagram above summarizes the entire workflow in predicting C02 emissions. For the model, we used a Random Forest Regression since the model’s going to predict the Philippines’ C02 levels. So given the model, the approach we did is more of predicting rather than forecasting as the model will just predict the Philippines’ C02 levels based on how other countries move on a given date, considering as well their individual attributes.
Results
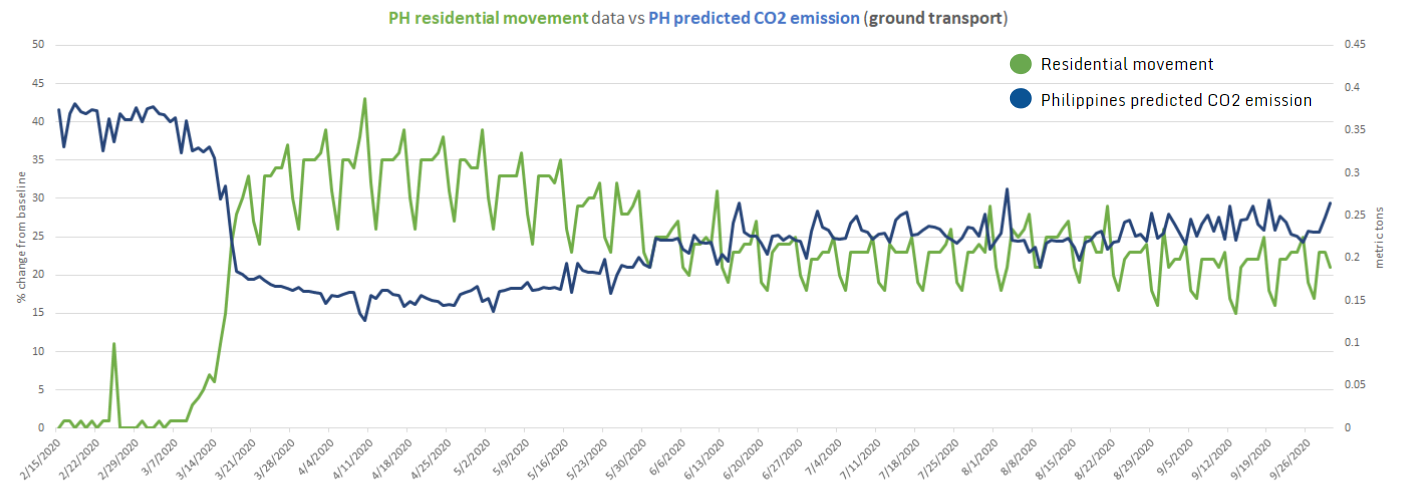
Looking at the predictions, it was able to produce the same trend from figure 2 that when residential movement increases, the emissions produced by transport reduces. In such manner, we can say that this is definitely an accurate trend line for emissions produced by transport. But what about its levels compared to other countries?
Predicted Values vs. Other Countries
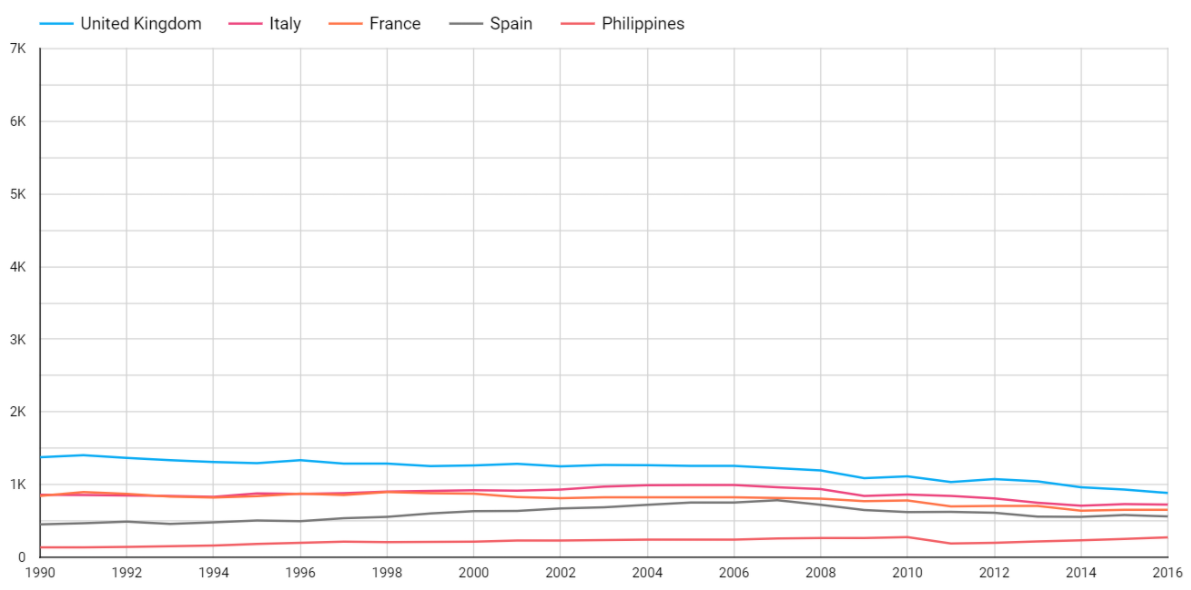
Among the countries with 2020 c02 data, the Philippines is lower than Brazil, India, Japan, and Russia compared with the predicted values.
But looking at France, UK, Italy, and Spain, these countries have the same levels as the Philippines. We did another prediction for emissions produced by power and the results are more or less the same.
So just basing from our predicted values in this little exercise of ours, the Philippines is not the lowest but is among the countries with low C02 emissions in 2020 . Take our prediction with a grain of salt since the model had a 90% test score which makes the model heavily biased with the available datasets, and there are also lots of missing factors as well to make the prediction closer to what the actual values may be.
Caveats to note
The reason why the Philippines’ predicted emissions are similar to these countries is because they are the countries whose climate watch data are the closest to the Philippines. Also, the reason why these are the only countries similar to the Philippines is because we only used the countries available on Carbon Monitor that have 2020 C02 data, and Carbon Monitor only has 12! It would be helpful to have at least have most of the SEA countries here for a much better comparison of country attributes to countries that are more similar to the Philippines.
Speaking of attributes, other factors such as population, investments in transportation, number of businesses, registered vehicles, and others that could be used as basis to further differentiate countries from one another should also be used in order to compare the Philippines to countries that share the same state as us. Because for this model, we only based it on how the Philippines is similar to producing C02 emissions to other countries.
Raw movement data would be helpful as well since the Google Mobility reports aggregate each country’s movements from -100 to 100, so if the values were raw, the countries would be more different from one another taking into account the number of people moving per country. The mobility data also covers some areas from each country as well, and so it would be great if it covers majority of the country’s area to reduce bias.
Eskwelabs’ Fellows for Social Good
This project was done in collaboration with Eskwelabs and Climate Reality Project for Eskwelab’s Fellows for Social Good event where alumni work together on small projects that aim to solve social problems through the use of data.

